Deploy Prometheus and Grafana for performance monitoring
Performance monitoring support enables admins to track system health for large Enterprise deployments through integrations with Prometheus and Grafana. These integrations support data collection from several Mattermost servers, which is particularly useful if you're running Mattermost in high availability mode. Once you're tracking system health, you can set up performance alerts on your Grafana dashboard.
Admins can collect and store various data points from the Mattermost application in an OpenMetrics format by deploying Prometheus and Grafana.
Install Prometheus
-
Download a precompiled binary for Prometheus. Binaries are provided for many popular distributions, including Darwin, Linux, and Windows. For installation instructions, see the Prometheus install guides.
-
The following settings are recommended in the Prometheus configuration file named
prometheus.yml:# my global configglobal:scrape_interval: 5s # Set to 5 seconds for optimal performance monitoring.evaluation_interval: 5s # Set to 5 seconds for optimal performance monitoring.# scrape_timeout is set to the global default (10s).# Attach these labels to any time series or alerts when communicating with# external systems (federation, remote storage, Alertmanager).external_labels:monitor: 'mattermost-monitor'# Load rules once and periodically evaluate them according to the global 'evaluation_interval'.rule_files:# - "first.rules"# - "second.rules"# A scrape configuration containing exactly one endpoint to scrape:# Here it's Prometheus itself.scrape_configs:# The job name is added as a label `job=<job_name>` to any timeseries scraped from this config.- job_name: 'prometheus'# The scrape_interval can be overridden per job if needed (5s matches the global default).# scrape_interval: 5s# metrics_path defaults to '/metrics'# scheme defaults to 'http'.static_configs:- targets: ["<hostname1>:<port>", "<hostname2>:<port>"] -
Replace the
<hostname1>:<port>parameter with your Mattermost host IP address and port to scrape the data. It connects to/metricsusing HTTP. -
In the Mattermost System Console, go to Environment > Performance Monitoring to set Enable Performance Monitoring to true, then specify the Listen Address (port-only, e.g.,
8067), and select Save. See our Configuration Settings documentation for details.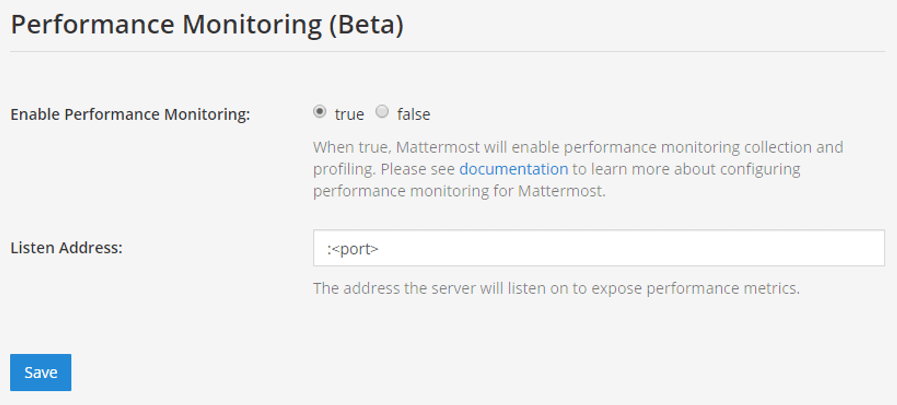
-
To test that the server is running, go to
<ip>:<port>/metrics.
- Finally, run
vi prometheus.ymlto finish configuring Prometheus. For starting the Prometheus service, read the comprehensive guides provided by Prometheus. - Once the service has started, you can access the data in
<localhost>:<port>/graph. While you can use the Prometheus service to create graphs, we'll focus on creating metric and analytics dashboards in Grafana.
Install Grafana
-
Download a precompiled binary for Grafana on Ubuntu or Debian. Binaries are also available for other distributions, including Redhat, Windows and Mac. For install instructions, see Grafana install guides
-
The Grafana package is installed as a service, so it is easy to start the server. See their install guides to learn more.
-
The default HTTP port is
3000and default username and password areadmin. -
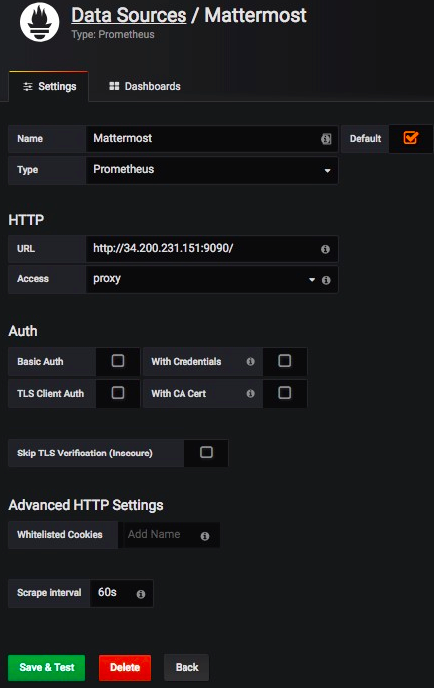
Add a Mattermost data source with the following settings as defined in the screenshot below
Getting started
To help you get started, you can download three sample dashboards shared in Grafana:
- Mattermost Performance Monitoring v2, which contains detailed charts for performance monitoring including application, cluster, job server, and system metrics.
- Mattermost Notification Health Monitoring, which can be used to track different types of notifications sent from Mattermost. System admins can disable notification monitoring data collection through the System Console.
- Mattermost Web App Performance Metrics, which contains detailed metrics for client-side performance, including web vitals and Mattermost-specifc metrics.
- Mattermost Desktop App Performance Metrics, which contains detailed metrics for client-side desktop performance, including CPU and memory usage metrics.
- Mattermost Mobile App Performance Metrics, which contains detailed metrics for client-side mobile performance, including web vitals and Mattermost-specifc metrics.
- Mattermost Threaded Discussion Metrics, which contains detailed metrics on the queries involved in our threaded discussions feature.
- Mattermost Performance KPI Metrics, which contains key metrics for monitoring performance and system health.
- Mattermost Performance Monitoring (Bonus Metrics), which contains additional metrics such as emails sent or files uploaded, which may be important to monitor in some deployments.
What's collected?
Mattermost provides custom metrics and standard Go metrics that can be used to monitor your system's performance.
When the AggregatePluginMetrics feature flag is enabled, plugin-provided metrics are included in the same /metrics scrape target and can be filtered by the plugin_id label.
Next steps
Once you've set up performance monitoring, you may want to:
- Set up performance alerts to be notified when metrics exceed thresholds.
- Deploy Grafana Loki for centralized logging to search and correlate logs with metric spikes.