Mattermost logging
Mattermost provides independent logging systems that can be configured separately with separate log files and rotation policies to meet different operational and compliance needs:
| Logging Type & Capture | Production Recommendation | Configuration Priority |
|---|---|---|
Log Settings All general Mattermost server operations, errors, startup/initialization, API calls, and system events. From v11.0, also includes notification subsystem events. | Always enabled. Console: INFO, File: INFO | High - Essential for operations |
Audit Log Settings Security and compliance events, user actions, API access, authentication events, and administrative changes. | Enable if compliance is required | Medium - Based on regulatory needs |
Notification Log Settings (applicable to v10.12 and earlier releases only) Notification subsystem events, push notifications, email delivery, mobile notification processing. | Enable for notification troubleshooting | Low - Enable when debugging issues |
By default, all Mattermost plans write logs to both the console and to the mattermost.log file in a machine-readable JSON format for log aggregation tools. Mattermost Enterprise and Professional customers can additionally log directly to syslog and TCP socket destination targets. Audit logging is designed to be asynchronous to minimize performance impact.
System admins can customize the following logging options based on your business practices and needs by going to System Console > Environment > Logging or by editing the config.json file directly.
Console logs
Console logs feature verbose debug level log messages for general activities that are written to the console using the standard output stream (stdout). You can customize console logs for general activities.
From Mattermost v11.0, notification logs are automatically included in the main console logs. See the Logging configuration settings for details.
File logs
File logs feature info level log messages for general activities including errors and information around startup, and initialization and webhook debug messages. The file is stored in ./logs/mattermost.log, rotated at 100 MB, and archived to a separate file in the same directory. You can customize file logs for general activities.
From Mattermost v11.0, notification logs are automatically included in the main mattermost.log file. See the Logging configuration settings for details.
You can optionally output log records to any combination of console, local file, syslog, and TCP socket targets, each featuring additional customization. See Advanced Logging for details.
Define logging output
Define logging output for general activities in JSON format in the System Console by going to Environment > Logging > Advanced Logging or by editing the config.json file directly.
You can use the sample JSON below as a starting point.
- v11 or later
- v10.12 or earlier
{
    "console1": {
        "type": "console",
        "format": "json",
        "levels": [
            {"id": 5, "name": "debug", "stacktrace": false},
            {"id": 4, "name": "info", "stacktrace": false, "color": 36},
            {"id": 3, "name": "warn", "stacktrace": false},
            {"id": 2, "name": "error", "stacktrace": true, "color": 31},
            {"id": 1, "name": "fatal", "stacktrace": true, "color": 31},
            {"id": 0, "name": "panic", "stacktrace": true, "color": 31},
            {"id": 10, "name": "stdlog", "stacktrace": false},

            {"id": 300, "name": "NotificationError", "stacktrace": true, "color": 31},
            {"id": 301, "name": "NotificationWarn", "stacktrace": false},
            {"id": 302, "name": "NotificationInfo", "stacktrace": false, "color": 36},
            {"id": 303, "name": "NotificationDebug", "stacktrace": false},
            {"id": 304, "name": "NotificationTrace", "stacktrace": false}
        ],
        "options": {
            "out": "stdout"
        },
        "maxqueuesize": 1000
    },
    "file1": {
        "type": "file",
        "format": "json",
        "levels": [
            {"id": 5, "name": "debug", "stacktrace": false},
            {"id": 4, "name": "info", "stacktrace": false},
            {"id": 3, "name": "warn", "stacktrace": false},
            {"id": 2, "name": "error", "stacktrace": true},
            {"id": 1, "name": "fatal", "stacktrace": true},
            {"id": 0, "name": "panic", "stacktrace": true},

            {"id": 300, "name": "NotificationError", "stacktrace": true},
            {"id": 301, "name": "NotificationWarn", "stacktrace": false},
            {"id": 302, "name": "NotificationInfo", "stacktrace": false},
            {"id": 303, "name": "NotificationDebug", "stacktrace": false},
            {"id": 304, "name": "NotificationTrace", "stacktrace": false}
        ],
        "options": {
            "filename": "mattermost_logging.log",
            "max_size": 100,
            "max_age": 1,
            "max_backups": 10,
            "compress": true
        },
        "maxqueuesize": 1000
    },
    "file2": {
        "type": "file",
        "format": "json",
        "levels": [
            {"id": 2, "name": "error", "stacktrace": true},
            {"id": 1, "name": "fatal", "stacktrace": true},
            {"id": 0, "name": "panic", "stacktrace": true},

            {"id": 300, "name": "NotificationError", "stacktrace": true},
            {"id": 301, "name": "NotificationWarn", "stacktrace": false}
        ],
        "options": {
            "filename": "mattermost_logging_errors.log",
            "max_size": 100,
            "max_age": 30,
            "max_backups": 10,
            "compress": true
        },
        "maxqueuesize": 1000
    }
}
{
    "console1": {
        "type": "console",
        "format": "json",
        "levels": [
            {"id": 5, "name": "debug", "stacktrace": false},
            {"id": 4, "name": "info", "stacktrace": false, "color": 36},
            {"id": 3, "name": "warn", "stacktrace": false},
            {"id": 2, "name": "error", "stacktrace": true, "color": 31},
            {"id": 1, "name": "fatal", "stacktrace": true, "color": 31},
            {"id": 0, "name": "panic", "stacktrace": true, "color": 31},
            {"id": 10, "name": "stdlog", "stacktrace": false}
        ],
        "options": {
            "out": "stdout"
        },
        "maxqueuesize": 1000
    },
    "file1": {
        "type": "file",
        "format": "json",
        "levels": [
            {"id": 5, "name": "debug", "stacktrace": false},
            {"id": 4, "name": "info", "stacktrace": false},
            {"id": 3, "name": "warn", "stacktrace": false},
            {"id": 2, "name": "error", "stacktrace": true},
            {"id": 1, "name": "fatal", "stacktrace": true},
            {"id": 0, "name": "panic", "stacktrace": true}
        ],
        "options": {
            "filename": "mattermost_logging.log",
            "max_size": 100,
            "max_age": 1,
            "max_backups": 10,
            "compress": true
        },
        "maxqueuesize": 1000
    },
    "file2": {
        "type": "file",
        "format": "json",
        "levels": [
            {"id": 2, "name": "error", "stacktrace": true},
            {"id": 1, "name": "fatal", "stacktrace": true},
            {"id": 0, "name": "panic", "stacktrace": true}
        ],
        "options": {
            "filename": "mattermost_logging_errors.log",
            "max_size": 100,
            "max_age": 30,
            "max_backups": 10,
            "compress": true
        },
        "maxqueuesize": 1000
    }
}
Audit logging
By default, Mattermost doesn't write audit logs locally to a file on the server, and the ability to enable audit logging in Mattermost is currently in Beta.
You can enable and customize advanced audit logging in Mattermost to record activities and events performed within Mattermost, such as user access to the Mattermost REST API or mmctl. Audit logs are recorded asynchronously to reduce latency to the caller, and are stored separately from general logging. During short spans of inability to write to targets, the audit records buffer in memory with a configurable maximum record cap. Based on typical audit record volumes, it could take many minutes to fill the buffer. After that, the records are dropped, and the record drop event is logged. From Mattermost v12.0, this shared audit queue holds up to 10,000 records, increased from 1,000. It's separate from the per-target maxqueuesize option, which caps the queue of an individual output target and is unchanged.
- Self-Hosted Deployments
- Cloud Deployments
Go to System Console > Compliance > Audit Logging to customize audit logging. You can use the sample JSON below as a starting point.
You can customize console logs for general activities. From v11.0, notification logs are automatically included unless advanced logging is configured.
Additionally, you can also output audit log records to any combination of console, local file, syslog, and TCP socket targets, each featuring additional customization. See Advanced Logging below for details.
From Mattermost v10.11, go to System Console > Compliance > Audit Logging to customize audit logging. You can use the sample JSON below as a starting point. Prior to Mattermost v10.11, customize audit logging by going to System Console > Experimental > Features > Audit Logging.
Log path restrictions
From Mattermost v11.4, log file paths are validated to ensure they remain within a designated logging root directory. This security enhancement prevents log files from being written to or read from unauthorized locations on the file system.
Configure the logging root directory
From Mattermost v11.4, use the MM_LOG_PATH environment variable to define the root directory for all log files:
export MM_LOG_PATH=/var/log/mattermost
If MM_LOG_PATH isn't set, Mattermost uses the default logs directory relative to the Mattermost binary location.
Log path validation
All log file paths configured via the following settings are validated:
LogSettings.FileLocation- main server log file locationLogSettings.AdvancedLoggingJSON- all file targets in advanced logging configurationExperimentalAuditSettings.AdvancedLoggingJSON- all file targets in audit logging configuration
How validation works:
- Paths are resolved to absolute paths
- Symlinks are resolved to their actual locations
- The resolved path is validated against the logging root directory
- Paths outside the root directory generate error logs and are excluded from downloads
Validation occurs:
- When accessing log files via System Console > Reporting > Server Logs
- When generating support packets
- During configuration changes (warnings are logged for invalid paths)
When a log file path is outside the allowed root directory, Mattermost logs an error and excludes the file from support packet downloads: "Blocked attempt to read log file outside allowed root". The error message includes the file path, configuration section, and validation failure details.
Configuration requirements
If using default logging: No action required. Logs are stored in the default logs directory.
If using custom log paths: Ensure all log file paths in AdvancedLoggingJSON point to locations within your logging root directory.
Valid configuration example:
export MM_LOG_PATH=/var/log/mattermost
In config.json:
{
  "file1": {
    "type": "file",
    "format": "json",
    "levels": [
      {"id": 2, "name": "error", "stacktrace": true}
    ],
    "options": {
      "filename": "/var/log/mattermost/errors.log",
      "max_size": 100,
      "max_age": 7,
      "max_backups": 10,
      "compress": true
    },
    "maxqueuesize": 1000
  }
}
This configuration is valid because /var/log/mattermost/errors.log is within the /var/log/mattermost root.
Invalid configuration example:
If MM_LOG_PATH=/var/log/mattermost, this configuration fails:
{
  "file1": {
    "type": "file",
    "options": {
      "filename": "/tmp/logs/app.log"
    }
  }
}
This fails because /tmp/logs/app.log is outside the /var/log/mattermost root directory.
See the troubleshooting documentation for troubleshooting steps if logs aren't appearing in the System Console or support packets due to log path issues.
Advanced logging
System admins can output log and audit records for general and audit activities to any combination of console, local file, syslog, and TCP socket targets.
Advanced logging options can be configured to:
- Enable trace logging for AD/LDAP to troubleshoot authentication issues.
- Capture errors and panics in a separate, monitored file that triggers alerts.
- Capture production debug and error logs in a separate file with log file rotation to reproduce issues, while enforcing a cap on the amount of disk space the debug logs are allowed to use.
- Audit every API endpoint accessed during a user workflow.
Define advanced log output
- Multi-line JSON
- Filespec
In the example below, file output is written to ./logs/audit.log in plain text and includes audit log levels 100-103 and their events. Older logs are kept for 1 day, and up to a total of 10 backup log files are kept at a time. Logs are rotated using gzip when the maximum size of the log file reaches 500 MB. A maximum of 1000 audit records can be queued/buffered while writing to the file.
v11 or later
"AdvancedLoggingJSON": {
    "file_1": {
        "type": "file",
        "format": "plain",
        "format_options": {
            "disable_level": false
        },
        "levels": [
            { "id": 100, "name": "audit-api" },
            { "id": 101, "name": "audit-content" },
            { "id": 102, "name": "audit-permissions" },
            { "id": 103, "name": "audit-cli" }
        ],
        "options": {
            "compress": true,
            "filename": "./logs/audit.log",
            "max_age": 1,
            "max_backups": 10,
            "max_size": 500
        },
        "maxqueuesize": 1000
    },
    "file_notifications": {
        "type": "file",
        "format": "json",
        "levels": [
            { "id": 300, "name": "NotificationError" },
            { "id": 301, "name": "NotificationWarn" },
            { "id": 302, "name": "NotificationInfo" },
            { "id": 303, "name": "NotificationDebug" },
            { "id": 304, "name": "NotificationTrace" }
        ],
        "options": {
            "compress": true,
            "filename": "./logs/notifications.log",
            "max_age": 7,
            "max_backups": 5,
            "max_size": 200
        },
        "maxqueuesize": 1000
    }
}
v10.12 or earlier
"AdvancedLoggingJSON": {
    "file_1": {
        "type": "file",
        "format": "plain",
        "format_options": {
          "disable_level": false
        },
        "levels": [
            { "id": 100, "name": "audit-api" },
            { "id": 101, "name": "audit-content" },
            { "id": 102, "name": "audit-permissions" },
            { "id": 103, "name": "audit-cli" }
        ],
        "options": {
            "compress": true,
            "filename": "./logs/audit.log",
            "max_age": 1,
            "max_backups": 10,
            "max_size": 500
        },
        "maxqueuesize": 1000
    }
}
Advanced logging configuration can be pointed to a filespec to another configuration file, rather than multi-line JSON, to keep the config.json file tidy:
"AdvancedLoggingJSON": "/path/to/audit_log_config.json"
The separate configuration file includes the multi-line JSON instead.
In the example below, the first output is written to the console in plain text and includes audit log levels 100-103, their events, and command outputs. A pipe | delimiter is placed between fields.
A second output is written to ./logs/audit.log in plain text in a machine-readable JSON format and includes audit log levels 100-103, their events, and command outputs. Older logs are kept for 1 day, and up to a total of 10 backup log files are kept at a time. Logs are rotated using GZIP when the maximum size of the log file reaches 500 MB. A maximum of 1000 audit records can be queued/buffered while writing to the file.
Contents of audit_log_config.json file:
v11 or later
{
    "sample-console": {
        "type": "console",
        "format": "plain",
        "format_options": {
            "delim": " | "
        },
        "levels": [
            {"id": 100, "name": "audit-api"},
            {"id": 101, "name": "audit-content"},
            {"id": 102, "name": "audit-permissions"},
            {"id": 103, "name": "audit-cli"}
        ],
        "options": {
            "out": "stdout"
        },
        "maxqueuesize": 1000
    },
    "sample-file": {
        "type": "file",
        "format": "json",
        "levels": [
            {"id": 100, "name": "audit-api"},
            {"id": 101, "name": "audit-content"},
            {"id": 102, "name": "audit-permissions"},
            {"id": 103, "name": "audit-cli"}
        ],
        "options": {
            "filename": "./logs/audit.log",
            "max_size": 500,
            "max_age": 1,
            "max_backups": 10,
            "compress": true
        },
        "maxqueuesize": 1000
    },
    "notifications-file": {
        "type": "file",
        "format": "json",
        "levels": [
            {"id": 300, "name": "NotificationError"},
            {"id": 301, "name": "NotificationWarn"},
            {"id": 302, "name": "NotificationInfo"},
            {"id": 303, "name": "NotificationDebug"},
            {"id": 304, "name": "NotificationTrace"}
        ],
        "options": {
            "filename": "./logs/notifications.log",
            "max_size": 200,
            "max_age": 7,
            "max_backups": 5,
            "compress": true
        },
        "maxqueuesize": 1000
    }
}
v10.12 or earlier
{
    "sample-console": {
        "type": "console",
        "format": "plain",
        "format_options": {
            "delim": " | "
        },
        "levels": [
            {"id": 100, "name": "audit-api"},
            {"id": 101, "name": "audit-content"},
            {"id": 102, "name": "audit-permissions"},
            {"id": 103, "name": "audit-cli"}
        ],
        "options": {
            "out": "stdout"
        },
        "maxqueuesize": 1000
    },
    "sample-file": {
        "type": "file",
        "format": "json",
        "levels": [
            {"id": 100, "name": "audit-api"},
            {"id": 101, "name": "audit-content"},
            {"id": 102, "name": "audit-permissions"},
            {"id": 103, "name": "audit-cli"}
        ],
        "options": {
            "filename": "./logs/audit.log",
            "max_size": 500,
            "max_age": 1,
            "max_backups": 10,
            "compress": true
        },
        "maxqueuesize": 1000
    }
}
Specify destination targets
Log records can be sent to any combination of console, local file, syslog, and TCP socket targets. Log targets have been chosen based on support for the vast majority of log aggregators and other log analysis tools, without needing additional software installed.
System admins can define multiple log targets to:
- Mirror log output to files and log aggregators for redundancy.
- Log certain entries to specific destinations. For example, all
audit-contentrecords can be routed to a different destination than the other levels. - Admins can also temporarily disable log targets by setting its
typetonone.
Configure format preferences
System admins can control log formatting per target by configuring the format_options section.
Plain log format configuration options
| Key | Type | Description |
| disable_timestamp | bool | Disables output of the timestamp. Default is false. |
| disable_level | bool | Disables output of the level name. Default is false. |
| disable_msg | bool | Disables output of the message text. Default is false. |
| disable_fields | bool | Disables output of all fields. Default is false. |
| disables_stacktrace | bool | Disables output of stack traces. Default is false. |
| enable_caller | string | Enables output of the file and line number that emitted a log record. Default is false. |
| delim | string | Delimiter placed between fields. Default is single space. |
| min_level_len | number | Minimum level name length. When level names are less than the minimum, level names are padded with spaces. Default is 0. |
| min_msg_len | number | Minimum message length. When message text is less than the minimum, message text is padded with spaces. Default is 0. |
| timestamp_format | string | Format for timestamps. Default is RFC3339. |
| line_end | string | Alternative end of line character(s). Default is n. |
| enable_color | bool | Enables color for targets that support color output. Default is false. |
JSON log format configuration options
| Key | Type | Description |
| disable_timestamp | bool | Disables output of the timestamp. Default is false. |
| disable_level | bool | Disables output of the log level display name. Default is false. |
| disable_msg | bool | Disables output of the message text. Default is false. |
| disable_fields | bool | Disables output of all fields. Default is false. |
| disables_stacktrace | bool | Disables output of stack traces. Default is false. |
| enable_caller | string | Enables output of the file and line number that emitted a log record. Default is false. |
| timestamp_format | string | Format for timestamps. Default is RFC3339. |
GELF log format configuration options
| Key | Type | Description |
| hostname | string | Outputs a custom hostname in log records. If omitted, hostname is taken from the operating system. |
| enable_caller | string | Enables output of the file and line number that emitted a log record. Default is false. |
Configure log levels and events
| Key | Type | Description |
| id | number | Unique identifier of the log level. |
| name | string | Name of the log level. |
| stacktrace | bool | Outputs a stack trace. Default is false. |
| color | number | The ANSI color code used to output parts of the log record. Supported values include:
|
Log levels
The following log levels support audit logs:
| ID | Name | Description |
| 100 | audit-api | API events |
| 101 | audit-content | Content changes. This log level can generate considerably more records than the other audit log levels. |
| 102 | audit-permissions | Permission changes |
| 103 | audit-cli | CLI operations |
| 104 | audit-delivery | Deliveries of message content to users, plugins, and outgoing webhooks in eligible channels. Direct and group message channels are never eligible. Available from Mattermost v12.0. This log level generates considerably more records than any other audit log level. |
The following log levels support application logs:
| ID | Name | Description |
| 140 | LDAPError | AD/LDAP authentication errors |
| 141 | LDAPWarn | AD/LDAP authentication warnings |
| 142 | LDAPInfo | AD/LDAP authentication information logs |
| 143 | LDAPDebug | AD/LDAP authentication debug logs |
| 144 | LDAPTrace | AD/LDAP authentication trace logs. Replaces LdapSetings.trace from Mattermost v9.3. |
Configure target-specific settings
Console target configuration options
Console targets can be either stdout or stderr.
- The standard output stream,
stout, is typically used for command output that prints the results of a command to the user. - The standard error stream,
sterr, is typically used to print any errors that occur when a program is running.
File target configuration options
File targets support rotation and compression triggered by size and/or duration.
| Key | Type | Description |
| filename | string | Full path to the output file. From v11.4, should be within the directory specified by MM_LOG_PATH. |
| max_size | number | Maximum size, in megabytes (MB), the log file can grow before it gets rotated. Default is 100 MB. |
| max_age | number | Maximum number of days to retain old log files based on the timestamp encoded in the filename. Default is 0 which disables the removal of old log files. |
| max_backups | number | Maximum number of old log files to retain. Default is 0 which retains all old log files. Note: Configuring max_age can result in old log files being deleted regardless of this configuration value. |
| compress | bool | Compress rotated log files using gzip. Default is false. |
Syslog target configuration options
Syslog targets support local and remote syslog servers, with or without TLS transport. Syslog target support requires Mattermost Enterprise.
| Key | Type | Description |
| host | string | IP or domain name of the server receiving the log records. |
| port | number | Port number for the server receiving the log records. |
| tls | bool | Create a TLS connection to the server receiving the log records. Default is false. |
| cert | string | Path to a cert file (.pem) to be used when establishing a TLS connection to the server. |
| insecure | bool | Mattermost accepts any certificate presented by the server, and any host name in that certificate. Default is false. Note: Should only be used in testing environments, and shouldn’t be used in production environments. |
| tag | string | Syslog tag field. |
TCP target configuration options
The TCP socket targets can be configured with an IP address or domain name, port, and optional TLS certificate. TCP socket target support requires Mattermost Enterprise. You can download a sample JSON file of the configuration to use as a starting point.
| Key | Type | Description |
| host | string | IP or domain name of the server receiving the log records. |
| port | number | Port number for the server receiving the log records. |
| tls | bool | Create a TLS connection to the server receiving the log records. Default is false. |
| cert | string | Path to a cert file (.pem) to be used when establishing a TLS connection to the server. |
| insecure | bool | Mattermost accepts any certificate presented by the server, and any host name in that certificate. Default is false. Note: Should only be used in testing environments, and shouldn’t be used in production environments. |
Cluster job execution debug messages
From Mattermost v11.4, debug-level log messages are available to help system admins understand cluster job execution behavior in high availability deployments for specific Recurring Tasks.
These debug messages apply only to the following Recurring Tasks:
- Scheduled Posts
- Post Reminders
- DND Status Reset
Debug messages for job startup
When a non-leader node starts up, it skips initialization for these specific Recurring Tasks and logs one of the following debug messages:
Skipping scheduled posts job startup since this is not the leader nodeSkipping unset DND status job startup since this is not the leader nodeSkipping post reminder job startup since this is not the leader node
These messages indicate normal operation. In a high availability cluster, these Recurring Tasks should only run on the leader node to prevent duplicate execution.
Debug messages for leadership changes
When a node loses leadership status while these Recurring Tasks are running, it cancels the running tasks and logs:
This is no longer leader node. Cancelling the [job name] task
Where [job name] is one of: scheduled posts, DND status reset, or post reminder.
This indicates the cluster is performing leader election correctly. The new leader node will take over execution of these Recurring Tasks.
Troubleshooting with cluster job debug messages
If you're investigating why Recurring Tasks (Scheduled Posts, Post Reminders, or DND Status Reset) aren't running on a specific node:
- Enable debug logging if not already enabled.
- Check the logs for the debug messages listed above.
- If you see these messages, the node is correctly identified as a non-leader and is behaving as expected.
- These Recurring Tasks will be running on the leader node instead.
For more information about leader election and cluster configuration, see High Availability cluster-based deployment.
Frequently asked questions
How do I enable debug logging?
As a Mattermost system admin, go to System Console > Environment > Logging > File Log Level, and set it to DEBUG. Then save your changes.
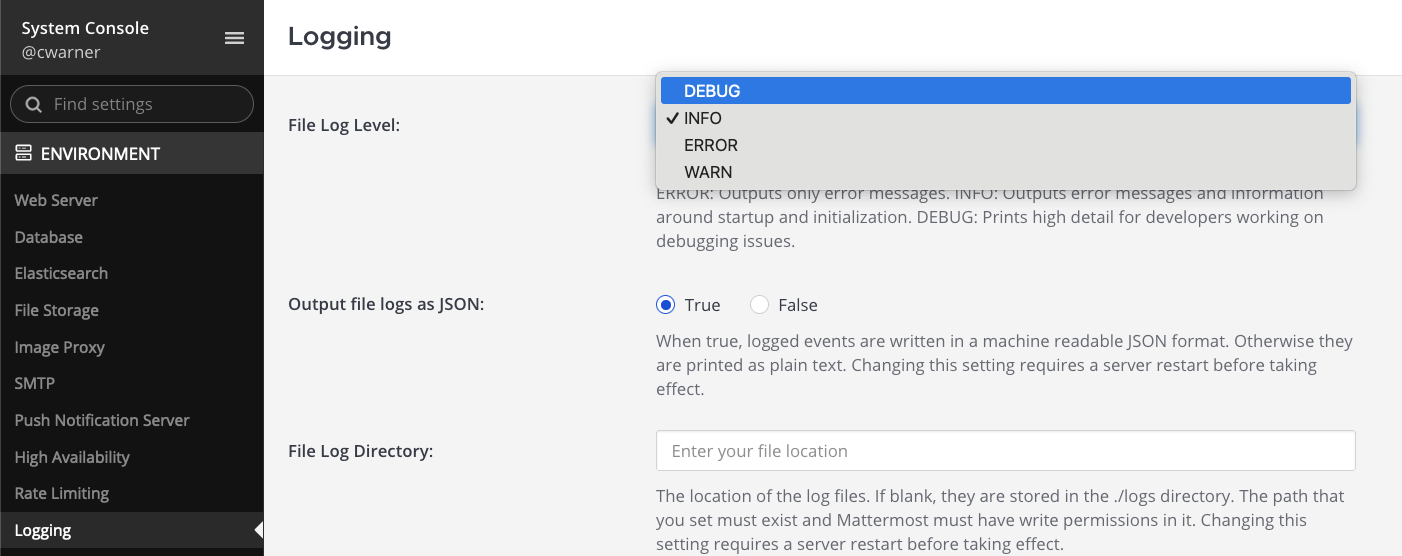
Debug logging can cause log files to expand substantially, and may adversely impact server performance. Keep an eye on your server logs, or only enable it temporarily, or in development environments, but not production enviornments.
Does Mattermost have an audit log besides the system auditd?
Yes. See the audit logging documentation for details.
When syslog is configured as the target, does it contain the IP address of the emitter of the data (i.e., the Mattermost app node)?
Yes. That is a function of the syslog daemon (receiver). Typically, all the log lines are prefixed with a timestamp and the hostname of the node sending the data. For example, a log line starts with: Nov 28 10:56:59 tower kernel: [1072437.431123] ...., where tower is the hostname of the server that generated the log line.
Once audit logs are enabled, can audit logging track events where an admin disables or modifies the audit log settings?
Yes, though it depends on how audit logs are configured. Audit log config can be specified via REST API, mmctl, System Console, file on disk, and using environment variables. When changes are made via the REST API or System Console, there is an audit record. However, the Mattermost server can't capture changes to a configuration file or via environment variables.
Do server logs show any information about a service or similar stopping/updating when auditing would be disabled?
Yes. When updating the audit log configuration via REST API, mmctl, or System Console, the last event of the audit log should be about the admin user updating the config of the server, which helps your security team identify which actions took place in the system and by whom.
How do I omit incoming webhook details from the logs?
How do I adjust the maximum log field size?
How can I configure Advanced logging via environment variables?
The MM_LOGSETTINGS_ADVANCEDLOGGINGJSON environment variable is used to configure Advanced logging . You can use jq to generate the JSON payload, e.g.
export MM_LOGSETTINGS_ADVANCEDLOGGINGJSON=$(jq -n -c '{
    "console1": {
        "Type": "console",
        "Format": "json",
        "Levels": [
            {"ID": 5, "Name": "debug", "Stacktrace": false},
            {"ID": 4, "Name": "info", "Stacktrace": false, "color": 36},
            {"ID": 3, "Name": "warn", "Stacktrace": false},
            {"ID": 2, "Name": "error", "Stacktrace": true, "color": 31},
            {"ID": 1, "Name": "fatal", "Stacktrace": true, "color": 31},
            {"ID": 0, "Name": "panic", "Stacktrace": true, "color": 31},
            {"ID": 10, "Name": "stdlog", "Stacktrace": false}
        ],
        "Options": {
            "Out": "stdout"
        },
        "MaxQueueSize": 1000
    }
}')
How can I turn on trace logging for LDAP?
Please use the following JSON configuration as as starting point to enable trace logging for LDAP:
{
    "ldap-file": {
        "type": "file",
        "format": "plain",
        "levels": [
            {
                "id": 144,
                "name": "LDAPTrace"
            },
            {
                "id": 143,
                "name": "LDAPDebug"
            },
            {
                "id": 142,
                "name": "LDAPInfo"
            },
            {
                "id": 141,
                "name": "LDAPWarn",
                "stacktrace": true
            },
            {
                "id": 140,
                "name": "LDAPError",
                "stacktrace": true
            }
        ],
        "options": {
            "filename": "./logs/ldap.log",
            "max_size": 100,
            "max_age": 14,
            "max_backups": 3,
            "compress": false
        },
        "maxqueuesize": 1000
    }
}
How do I configure centralized logging for Mattermost?
Mattermost recommends centralized logging using Grafana Loki and the OpenTelemetry Collector. See the Deploy Grafana Loki for centralized logging guide for details on how to set up log aggregation, useful LogQL queries, and Grafana dashboards.